See which customer areas contribute most to your sales, and where pricing power exists today

How wRatings Generates Success

wRatings Application Layers
Data Sources

We jump-start your research program using our W-30 benchmark data, and then add in your customer, financial and operating metric data

Collection

We’ve innovated data collection so you never annoy your customers; Our surveys take less than 5 minutes to complete, and often only 3 minutes

Analytics

Our system automatically analyzes your data for you to assess where to focus improvement efforts

Predictive/AI

We’ve built artificial intelligent tools to identify key areas contributing to your growth, and where the next best opportunities exist for you to invest

wRatings features

The Competitive Dashboard is the first thing you see when you log into our system. We pull together everything you need to know into a single pane decision view that acts as a command center to any other data views you want to see. You can tailor each dashboard view to meet your preferences.

At the core of the wRatings System is the use of Cards that save away complex queries and data sets to instantly display as a series of charts and tables. Your wRatings Research Advisor will jumpstart your Cards by pulling together the optimum views for your data to make growth decisions.

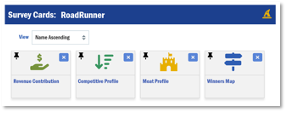
If “just send me the report” is your preference, our Reports combine all the key Cards into a unified view for you to save, download or print. No need to worry if your Cards have the most recent data, as you can set them to auto-update and generate a new W Report™ for you.

Use our chart criteria tools to target key groups within your data, and save them as a Card for future segmentation analytics. Your ability to segment respondents is unlimited.

Our most widely used chart that displays what your customers expect in order of importance and emotional intensity.

Organizes your customer performance by competitive strength area in the order that historically drives revenue growth. This powerful chart shows where challenges may be limiting your growth, and where opportunities exist to accelerate growth using early-mover moats (advantages).

Identifies the key value drivers of how customers make decisions in your industry. These innovative charts show how compelling value components combine to form emotional bonds.

Provides an insightful, unbiased assessment into how well you perform when compared to other internal locations/divisions or to top performing W-30 benchmark companies.

Use our AI tool to auto-arrange your customer data into Table Stakes, Core Strengths and Diverge opportunities to build your own map to win more customers.

Compare your performance over time, between other locations/divisions or dig into various customer segments to analyze your best opportunities to grow.

Track your improvement over time along any need, moat or overall satisfaction, including Net Promoter Score®.

Discover which areas of customer performance are most contributing to your growth in revenue, margins, profits or any other financial and operating metric you track. Identify the best sources of pricing power to build based on what customers crave the most and your ability to deliver on those areas today.

Companies Using wRatings to Grow Their Revenue

Receive Our Data

Receive notifications when competitive data on the W-30 companies is released.

Please enable JavaScript in your browser to complete this form.
Checkboxes