All trademarks are properties of their respective owners.
Moneyball started with the Oakland Athletics in 2002 when general manager Billy Beane needed to figure out how to win more games on a substantially reduced payroll. The art of winning in the unfair game of baseball took hold when Billy found undervalued players to build a team that won 103 games that season.
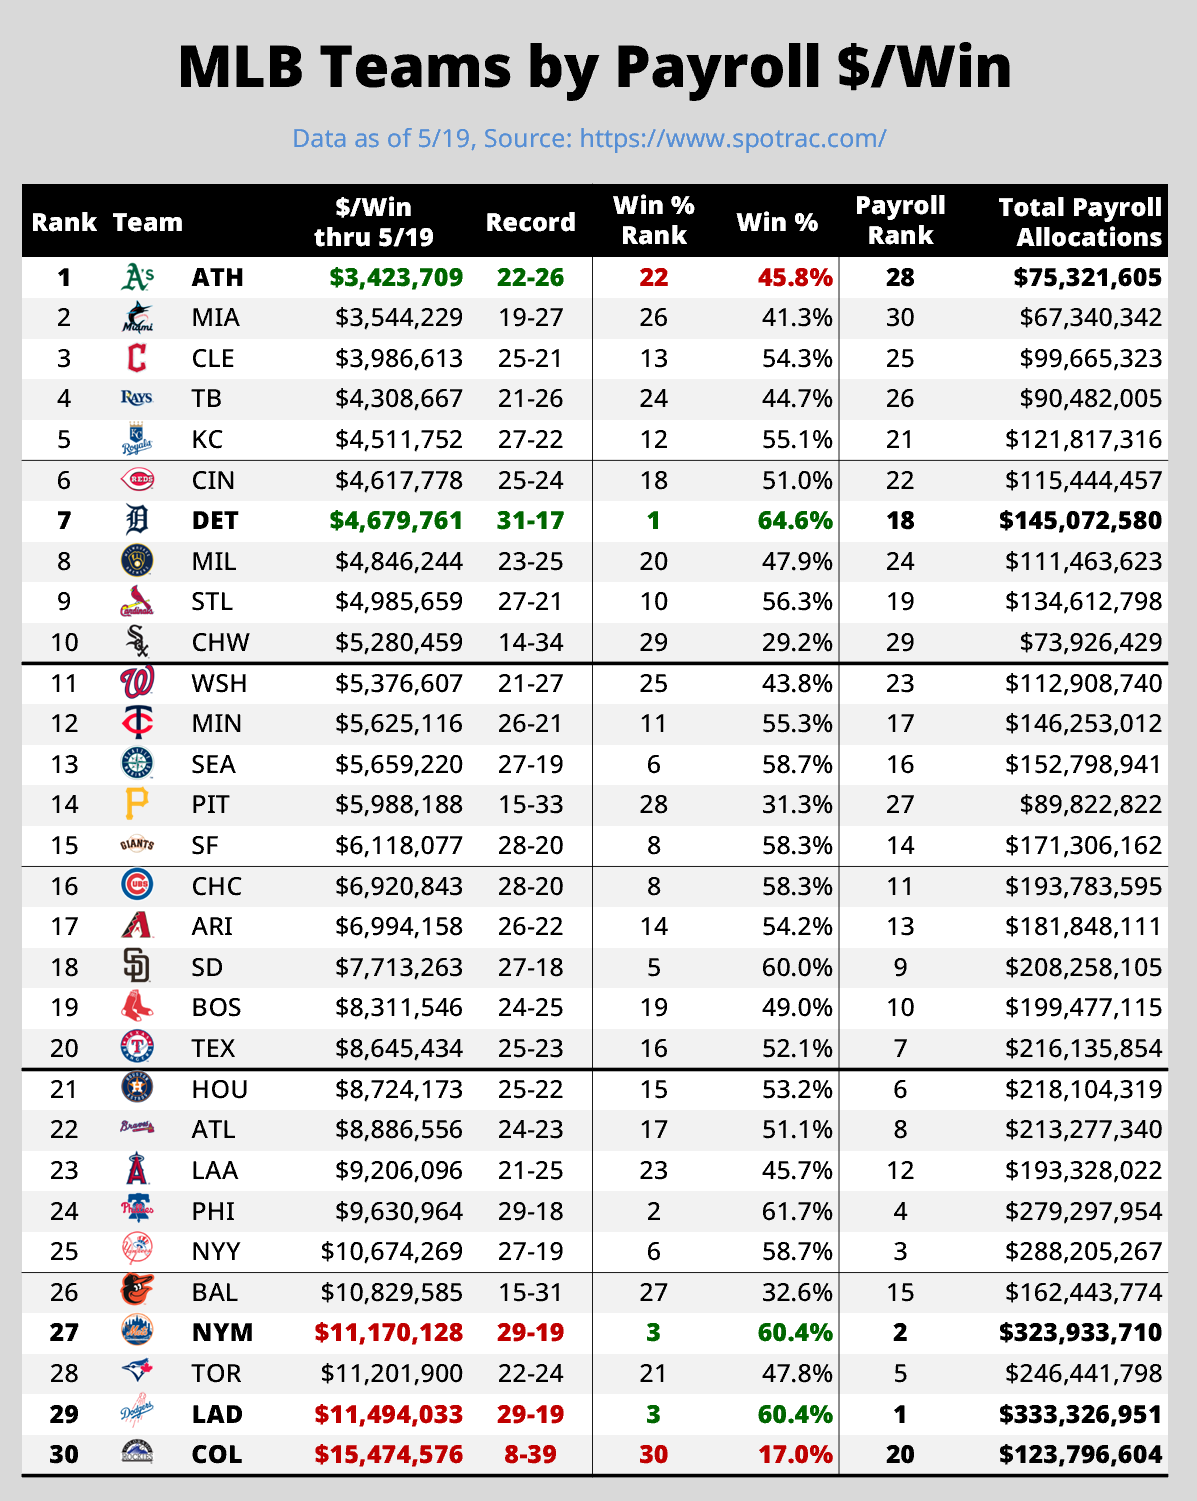
Fast forward to today – as of this past weekend – and the Athletics are the #1 team when it comes to how much they pay for each win: Just $3.4M. Compare that to the struggling Colorado Rockies, who rank last at $15.4M, which is 4.5X as much as the A’s. With their records, neither team is “winning” at this point in the season. [All stats from www.spotrac.com and as of 5/19].
But here’s the real stunner. The LA Dodgers rank #29 when it comes to Payroll $/Win at almost $11.5M, and the NY Mets rank #27 at almost $11.2M per win. Yet, both teams are ranked #3 in win/loss %. We also see this happen in the business world. Companies sacrifice their gross profits to pump up sales growth – aka, “wins.”
It’s not just about more sales (“wins”). It’s about profitable growth. This comes from working on those key areas where customers are not seeing value today, yet are willing to pay for. At wRatings, we measure both items through our Value Gaps and Willingness to Pay (WTP) metrics. In addition to sales growth, we measure gross profit growth. And unfortunately, this is where the Colorado Rockies and Boeing look a lot alike these days with their $/Win and GP Growth – they are both abysmal.
So what company is the equivalent of the Dodgers in business world currently? That would be none other than Toll Brothers, whose customers still love them (winning) but management continues to spend a lot of shareholder money in order to keep winning.
Profitable Winning: Detroit Tigers
The best team in baseball right now is the Detroit Tigers. They’ve also spent wisely at less than $4.7M per win, which makes them good for the #7 ranking in Payroll $/Win.
It’s still early in the season, but the Detroit Tigers are no fluke. They reached the playoffs last year for the first time in a decade. Many had them picked to come in second place this season, just behind the Cleveland Guardians.
According to ESPN stats, they don’t lead in either Runs Scored (#2 with 257), Runs Allowed (#8 with 177), nor run differential (#2 with +80). Like running a successful business, it’s about investing in the right things in order to generate profitable wins. Being the absolute best at one thing rarely wins championships.
Moving to the other end of the spectrum, close to the Colorado Rockies are the Toronto Blue Jays, ranking #28 in Payroll $/Win and #21 in Win % Rank. Worse yet, the Blue Jays have the fifth highest payroll allocation currently.
Profitable Winning: Roku
Just like MLB so far this season, we see several companies today that are misaligned with how customers perceive them (“winning”) and how profitable they are (“Payroll $/Win”). Let’s face it, achieving both simultaneously AND over long periods of time is enormously difficult.
Quite frankly, that’s why so many sports teams and wRatings clients use Moneyball analytics: To profitably win.
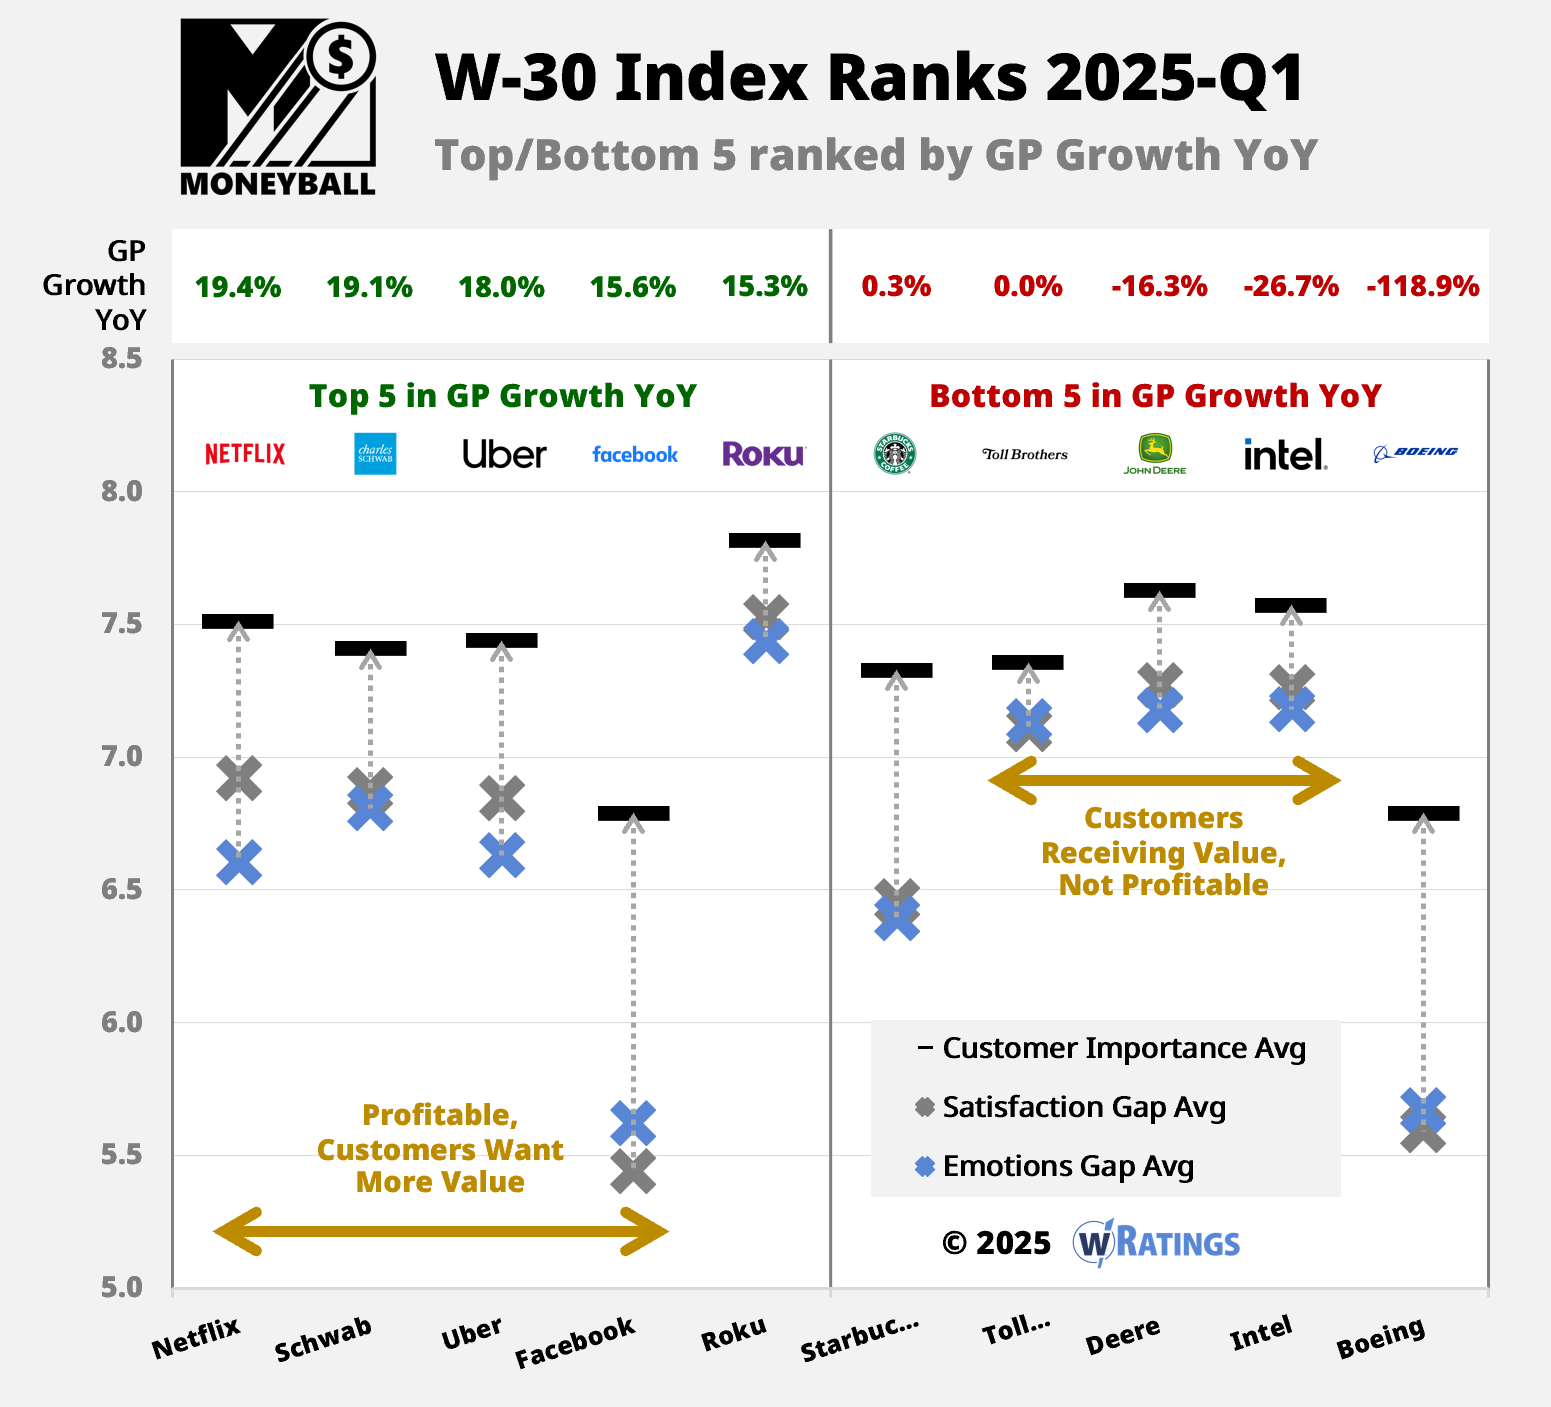
Just like in MLB so far, this year’s Detroit Lions in the W-30 Index is Roku. In 2025-Q1, they rank #5 in gross profit growth YoY and #6 in value gap rankings. [All customer and financial data are as of 5/19]
Flexibility is the top area where customers are willing to pay more, and customers prefer Roku’s independence from other hardware companies – very unlike Amazon or Apple. This enhances Roku’s ability to build a strong personal relationship with its community, The key for Roku rests in whether management figures out how to monetize their network effect moat.
Toll Brothers is the LA Dodgers today. In our 2025-Q1 Top 10 rankings, the home builder is winning customers over in their premium market – pretty similar to how Dodgers owners operate. The largest individual Dodgers owner is Mark Walter, the current CEO of Guggenheim Partners. No doubt his business acumen is helping chart a profitable course for the team. The Dodgers may be paying a lot for each win, but likely worth it given their top line. And Toll Brothers CEO Doug Yearley invests similarly. Ironically, both Toll Brothers and the Dodgers enjoy a strong brand reputation.
The company closest to the woes of the Colorado Rockies today is Boeing. Customers are definitely not happy, and gross profit growth is a whopping -118.9% currently while their large customer value gap ranks them #29 in the W-30 Index.
The only company worse with customers than Boeing? That would be Facebook (Meta). And yet Facebook’s gross profit remains in the top 5 of the W-30 Index. This indicates the power of what Warren Buffett refers to as an economic moat. Some business frameworks are so strong when built that they can hold customers captive, meaning that customers will escape once another company offers a viable alternative. The goal for Facebook is to figure out how to turn captive customers into vested customers.
Become a Winner
Stop giving away profits on every sale. Let the wRatings platform show you the analytics behind what your customers expect and are willing to pay for, and in turn, drive more profitable sales growth.