


All trademarks are properties of their respective owners.
Moneyball meets Hockey. How much has the NHL embraced the analytics craze? The number of NHL personnel working in analytics went from ~15 people in 2014 to ~150 today, with 22 of the 32 teams employing from two to five analysts.
And contrary to initial views about Moneyball in hockey, the new Money “Puck” analytics work . . . really well. A 2024 study found that one metric, Expected Goals (xG), was able to forecast goal counts for 70% of players within a two goal margin for the upcoming season. Combined with other game-tailored metrics, NHL teams and coaches today are using analytics to decide when to “pull the goalie”, who should take the last shot, and if or when to start a fight to gain momentum.
It’s all about how to exploit a rival’s weaknesses or launch a full attack based on your strengths. Advanced analytics show how to win hockey games.
At wRatings, we show executives the same type of winning analytics. We identify key competitive advantages for how companies can out-smart, out-sell, and out-execute their rivals. We show the analytics in Competitive Profiles, which allow you to data-drive a Road Map using your strengths, customer expectations, and customer willingness to pay (WTP).
Jack Welch said it best, “If you don’t have a competitive advantage, don’t compete.” The first part of this is to know where the best opportunities exist for you to build an advantage. That’s where analytics come in.
Pucks take crazy bounces – just ask any Vegas Golden Knights fan this past weekend. Randomness occurs in every sport to win a game or two, but analytics are what propel teams to become consistent winners.
The most common advanced metrics tracked by NHL teams today are xG (Expected Goals), Corsi (Shot Attempts), and Fenwick (Unblocked Shot Attempts). They combine to form powerful game strategies around territorial advantages and shot quality.
The goal here (pun intended) is to reduce uncertainty about the future and, of course, win. A real-world example is underway with the Carolina Hurricanes.
Carolina hired an outsider – a Berkley Chemistry PhD — named Eric Tulsky in 2014 to jumpstart their analytics program. In 2024, he became the Hurricanes GM, with Carolina one of the 8 teams still competing for this year’s Stanley Cup.
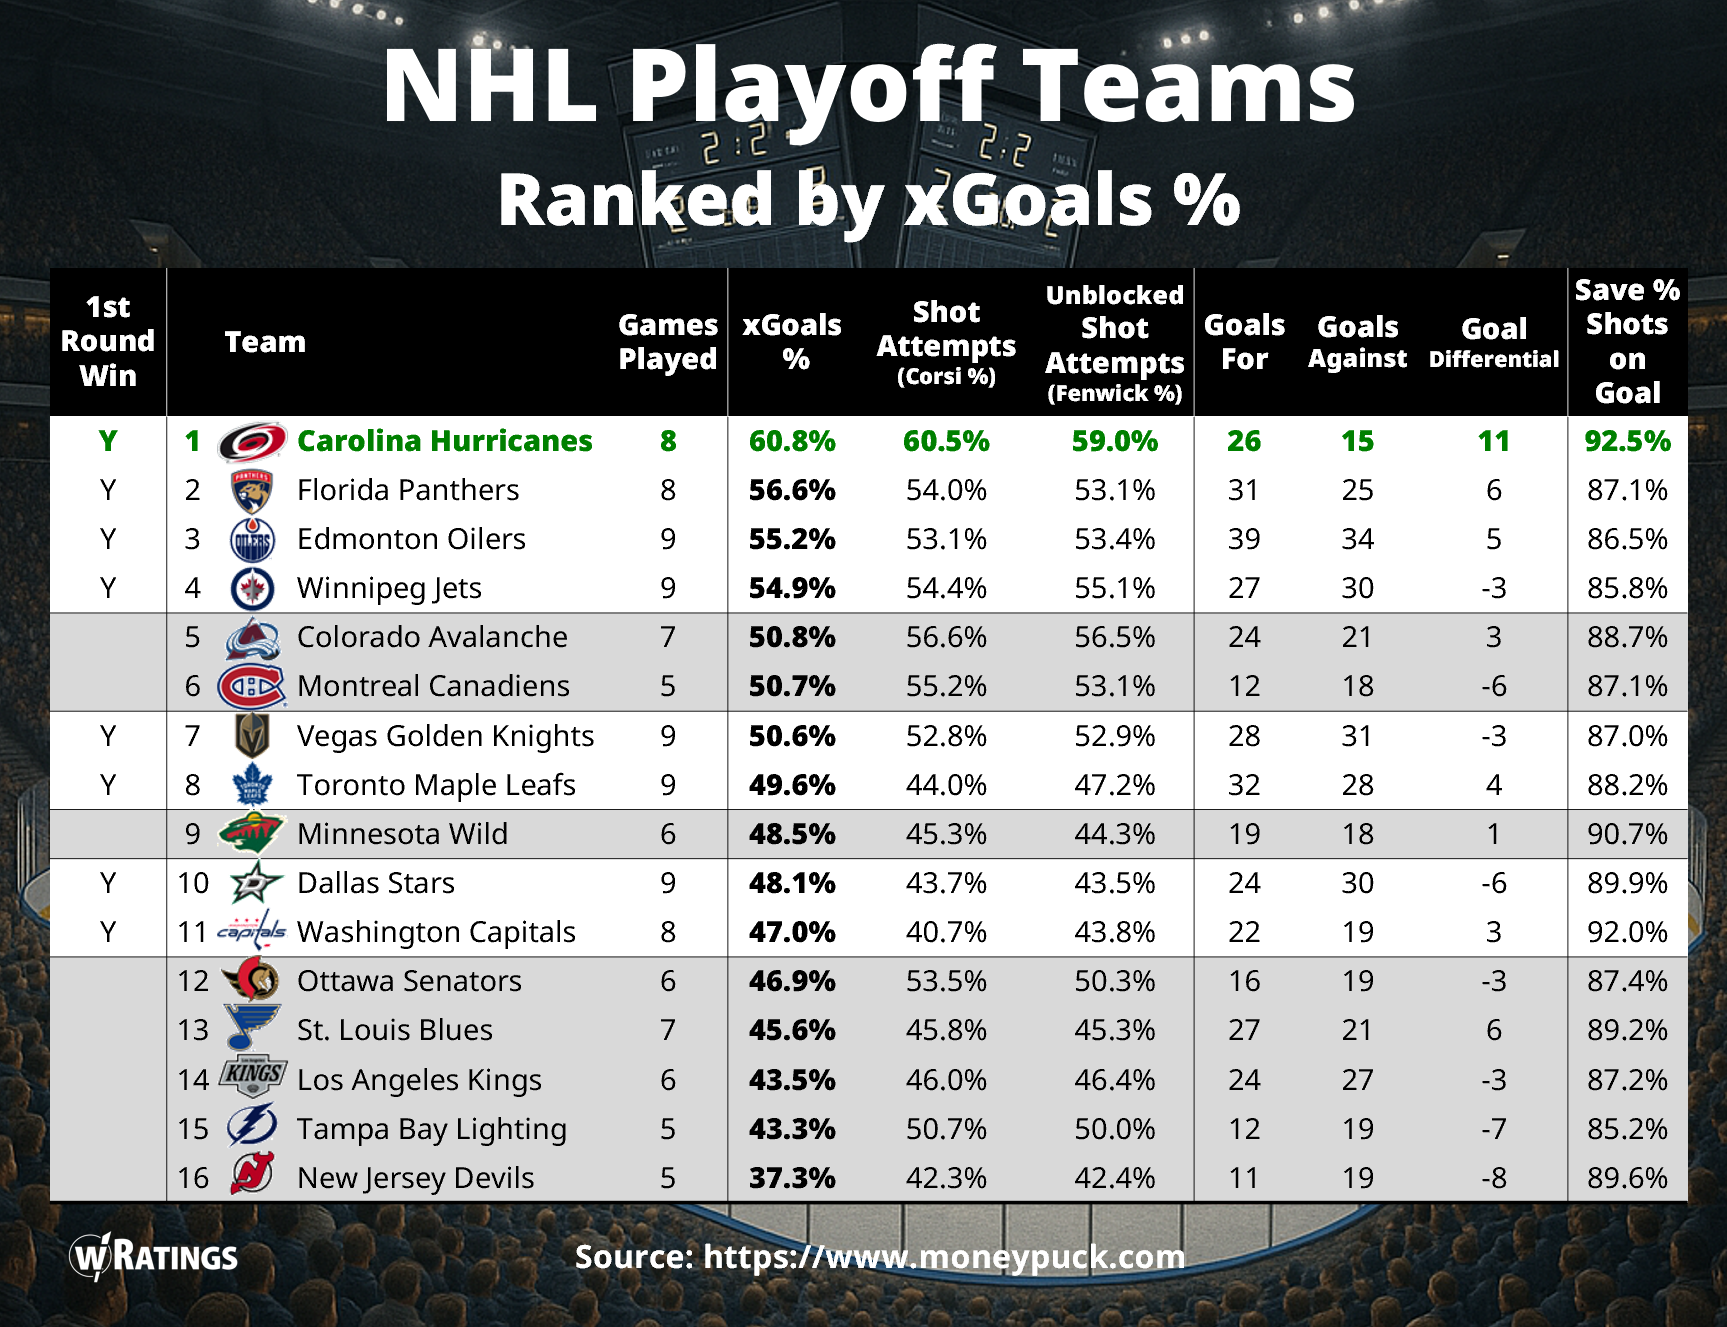
According to the Moneypuck.com website, Carolina is ranked #1 in xGoals % (using All Situations in the Playoffs through 5/11/2025). Rounding out the top 4 teams are Florida, Edmonton, and Winnipeg, who all won in the 1st Round to advance.
How did Carolina do it? They fully committed to the analytics revolution to find undervalued players. A few examples here. Taylor Hall had untapped potential with a 55% expected goals in the playoffs. Jordan Martinook was acquired in 2018 due to his defensive reliability. And long-time player Jaccob Slavin has excellent shot suppression and possession control metrics. Both Martinook and Slavin are alternate captains for the Hurricanes. All players were undervalued when Tulsky took over. Today, they are key parts to their winning.
Similar to business strategy, a hockey team only needs to build strong capabilities in a few areas to win.
GM Tulsky’s analytics-driven approach started to gain ground in the 2018-2019 season. His strategy is straight-forward and centers around three areas: Possession metrics, forechecking pressure, and defensive reliability. Carolina dominates in both possessions and scoring chance share, occupying the top position this season.
And this brings to one of the more unique factors about hockey: Fighting is allowed (although heavily penalized). Rule changes have reduced the number of fights per game. But can fights help win more games? Teams prioritizing fights over puck possession often underperform according to Corsi and xG. Fighting in hockey is unlike a basketball team executing a “Kill Shot,” where winning is much more likely.
Back in 2012 though, one study showed that starting a fight changes the momentum of a game. Researcher Terry Appleby found that fighting produced a surge of shots on goal 76% of the time. It just didn’t result in more wins. That’s likely why the NHL fights per game peaked way back in 1988 at over 1 per game to less than 0.2 per game in 2024.
Hall of famer Wayne Gretzky, aka “The Great One,” has one of the best quotes not just for hockey but for every business executive: “I skate to where the puck is going to be, not where it has been.”
Just like the Caroline Hurricanes built strengths where other teams didn’t have them, Costco built its competitive advantages by going in a different direction for growth. Most large retailers focus on economies of scale, where they offer numerous products all in one place. Mongomery Ward and Sears dominated for years based on scale, and Walmart came along to outsmart them with even more products in their rural stores. Amazon then surpassed them all to offer ~600 million SKUs (Stock Keeping Units) in 2023, compared to “only” Walmart’s ~400 million (including e-commerce).
Costco defied the industry status quo. They offer ~4,000 SKUs in its warehouses, far below the ~100,000 SKUs in a standard Walmart store. Yet, despite the huge differences in # of products sold, revenues TTM are only modestly different for Amazon ($619B), Walmart ($681B), and Costco ($264B).
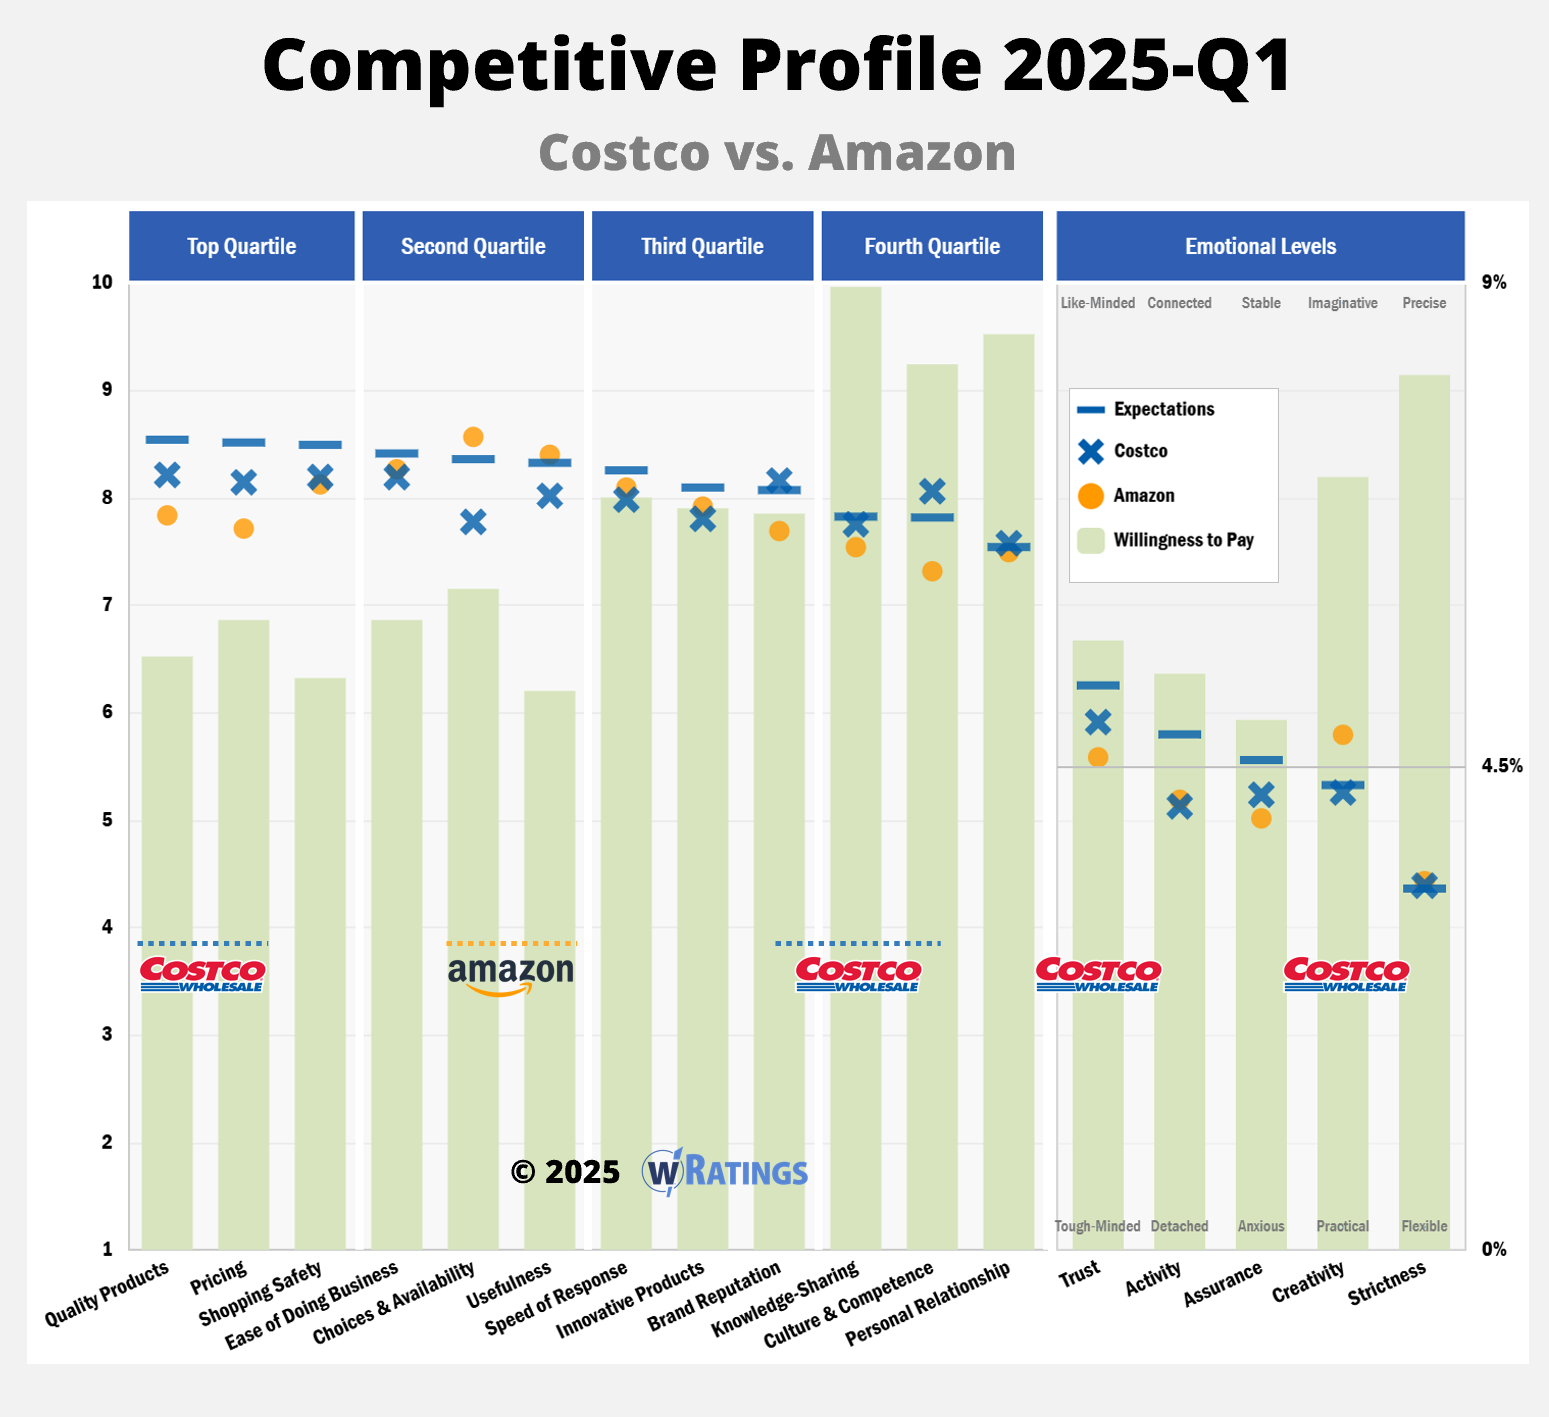
So how does Costco achieve this? By focusing on a few key customer strengths that others don’t or won’t. In their 2025-Q1 Competitive Profile, customers believe Costco is superior to Amazon in seven areas: Quality Products, Pricing, Brand Reputation, Knowledge-Sharing, Culture/Competence, Trust, and Creativity. Several areas where customers are willing to pay (WTP) the most, meaning that Costco has strong pricing power should they choose to exercise it.
Costco ceded full control to Amazon in two customer areas: Lots of choices of highly useful products. That’s exactly what investment decisions are all about: Pick a small set of customer needs to build that ensures your competitive advantage.
Costco is well-known for its strong supplier relationships which, in turn, allows them to offer advantageous prices to its customers. This builds customer trust and encourages them to routinely shop there.
The company also surprises customers with something special, providing a “treasure-hunting” aspect to their in-store shopping experience. Ironically, Costco remade K-Mart’s “Blue Light” special into their own secret weapon. Their treasure-hunt creates excitement, akin to how a basketball team creates momentum through a Kill Shot.
Costco is also well-known for treating employees with respect and paying them well. This attracts the best talent, creating a culture of competence that customers admire.
The key here is that Costco doesn’t try to be everything to everybody. They focus efforts on a small set of competitive factors which they own in the customer’s mind. Amazon, Walmart, and other big-box retailers are either unable or unwilling to challenge Costco in this way, cementing Costco as the market leader for this business framework.
Let the wRatings platform show you the analytics behind what your customers expect and are willing to pay for, and in turn, drive more profitable sales growth.
If you’d like access to our Moneyball analytics and benchmarking database, apply to become a wRatings Insider here.