


All trademarks are properties of their respective owners.
The fastest pitch ever thrown in MLB was by the Milwaukee Brewers’ Aroldis Chapman in 2010 against the San Diego Padre’s Tony Gwynn: 105.1 MPH. Gwynn did not swing since it was a ball, but he did strike out on another fastball.
Fifteen years later and the Brewers have themselves another flamethrower in rookie Jacob Misiorowski. He throws a 103 MPH fastball. In three starts, he has a 3-0 record while only giving up three hits. That’s impressive.
In the financial world, the 103 MPH equivalent is Cash App’s ability to instantly transfer cash via its P2P (peer-to-peer) network. Other businesses such as retailers and industrials also get evaluated by customers on speed, typically by measuring its on-time, in-full (OTIF) delivery skills.
The critical question for both baseball GMs and business CEOs is whether pitching speed or delivery speed translates into a competitive advantage. Can it help win more baseball games, or drive more corporate profit growth? Moneyball analytics show us the answers, and they differ for GMs and CEOs.
The best way to never lose a game in any sport is to never let the other team score. In baseball, just pitch a shutout. Most shutouts today aren’t from a single pitcher throwing a complete game. They are a “team shutout” where multiple pitchers play their part in the win.
The primary Moneyball analytic to examine pitching speed in MLB is “vFA,” which captures the average Fourseam Fastball velocity. Higher vFA indicates the team’s pitching staff, on average, throw faster than those below. Pitchers for Tampa Bay Rays, Atlanta Braves, and the Boston Red Sox occupy the top three spots.
The top 15 MLB teams in 2025 throw about 1 MPH faster than the bottom 15. They’ve won 3.27 more games, and possess a higher win % than the bottom 15 by 0.035.
Almost mid-way through the season, and higher pitching speeds appear to make a difference. Traditional statistics like ERA (Earned Run Average) also confirm this. Data from the 2024 season show that pitchers in the top 10% for fastball velocity (95+ MPH), had a 3.45 ERA average whereas those in the bottom 10% (<90 MPH) had a 4.10 ERA.
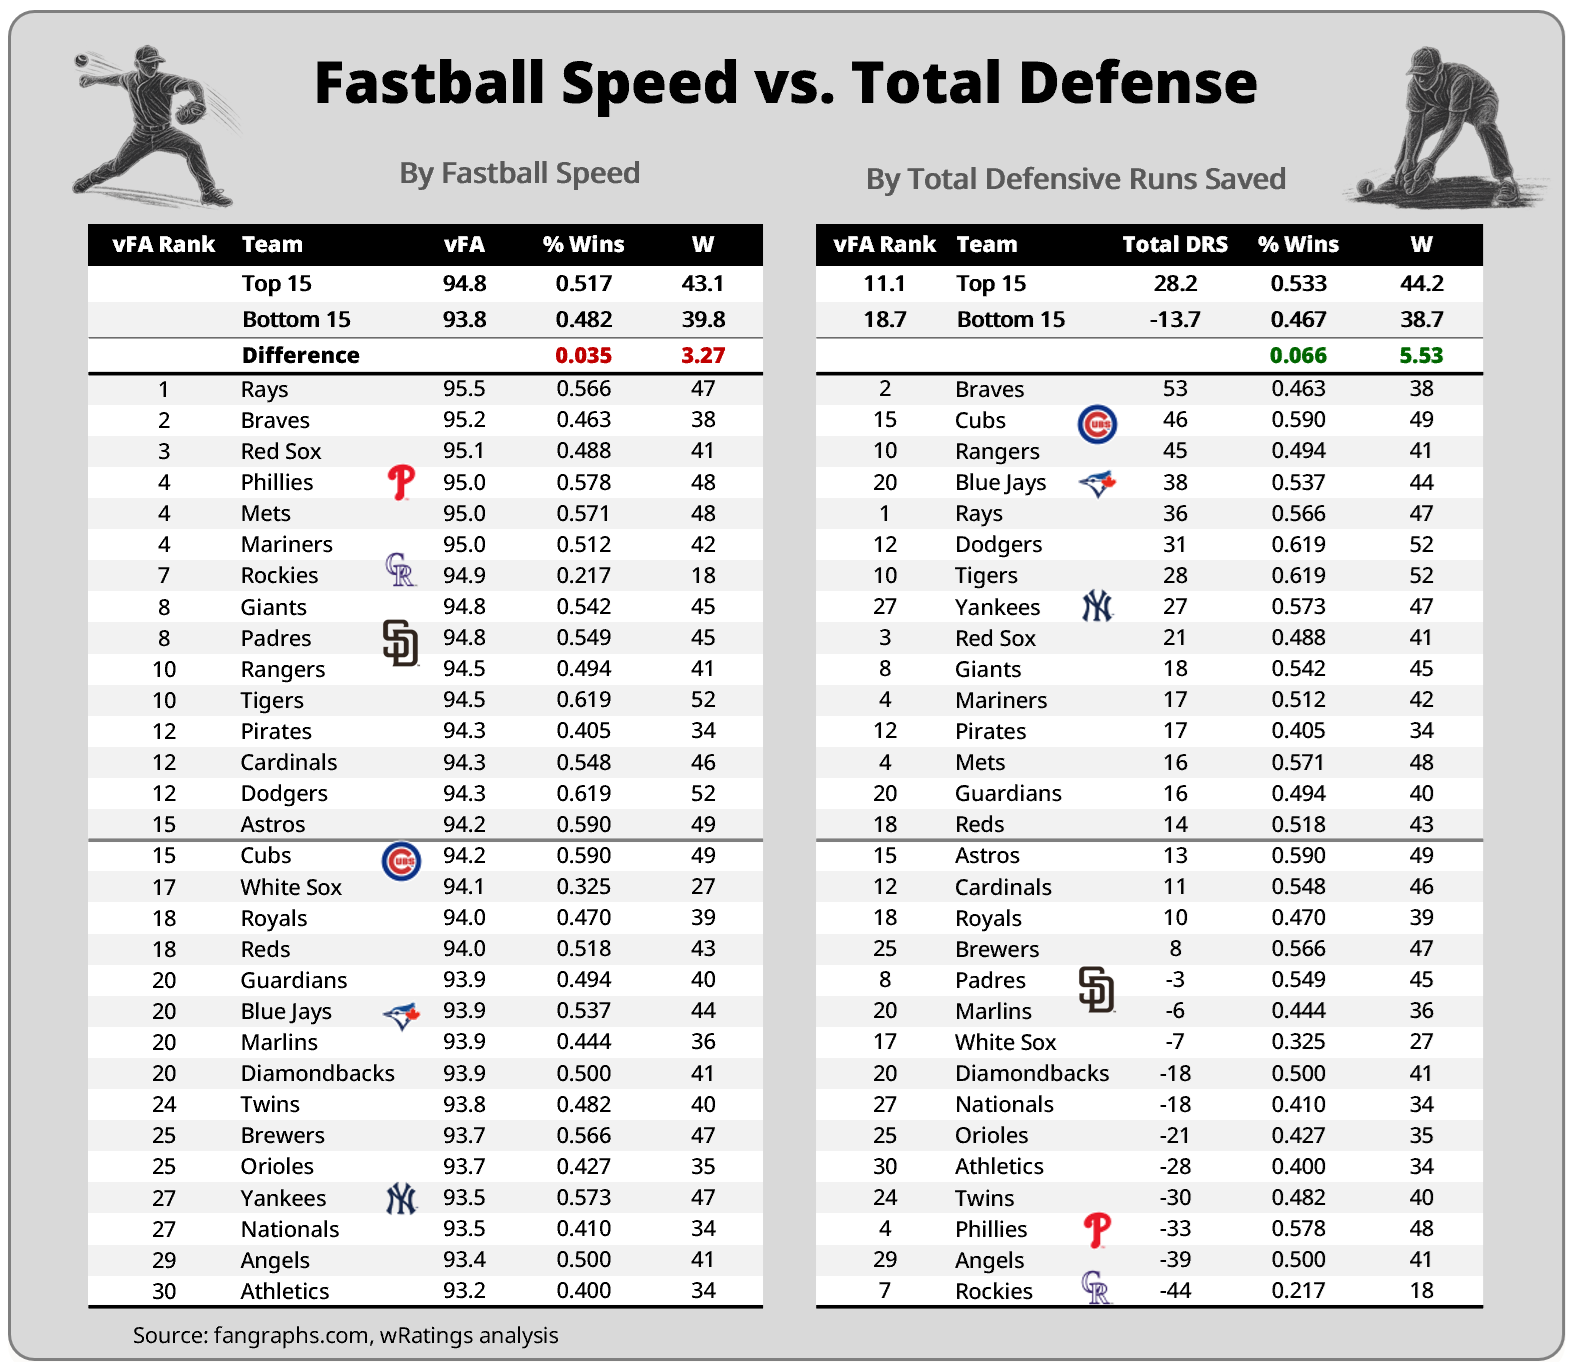
To examine if a Baseball GM should stock up on fast ball pitchers to win more games, we can add another layer of analysis. Since pitching a shutout today is a defense effort and not reliant on one dominant pitcher, we look at the best overall metric that measures a team’s defensive efforts: Total Defensive Runs Saved, or Total DRS, developed by Baseball Info Solutions.
This measures a team’s performance by how many runs a team saves or costs compared to an average team. This takes into account a myriad of scenarios such as double plays, bunts, range, arm strength, and other items across all positions, not just pitchers.
We can now look at the key win differences between a Top 15 and Bottom 15 team when it comes to winning %s. Total DRS difference is much stronger for a Top 15 than with vFA. The top 15 teams average over 5.5 more wins so far this season, with a better win % of 0.066. That’s almost 2X the win % of just fastball speed (vFA).
So far this season, total defense is winning more games than a high speed fastball. Correlation analysis, while not a cause-effect relationship, shows that Total DRS is much stronger (r=0.51) with % Wins than vFA (r=0.14).
Of the six teams with the largest difference in rank spot, the Phillies, Cubs, and Yankees are currently leading their division. Two are in the top 15 for Total DRS while only the Phillies are for vFA. Most prominent though is the Rockies. They possess the worst MLB record to date at 19-65, yet they are throwing the 7th fastest pitches.
Turning to GM strategy, the Kansas City Royals – a small market team with less than half the payroll of larger teams like the New York Yankees – won the 2015 World Series using a good lineup, great bullpen, and reasonably good starting rotation. By 2018 though, they were back to losing 100+ games. Their formula today abandons the great pitching approach and instead builds a team with more balance on offense and defense. They are focused on building a better defense to support their pitching staff. Last year, five of the top eight fielding teams made the playoffs and they were all small and mid-market teams.
Today, better defense is winning more games than just fast pitching. Similar to a previous blog, defense wins championships, just like Michael Jordan says.
Decades ago, when microwaves were just going mainstream, I recall a newspaper cartoon with a father and his son cooking some food in the microwave. The son asked, “Two minutes? I thought you said it was instant.”
While microwave technology has stayed consistent in respect to time required, customers in today’s world demand faster and faster delivery speeds. Fintech Cash App, owned by Block (NYSE: XYZ), offers a digital wallet where you can transfer money to other members within seconds using its P2P (peer-to-peer) network. For a small fee (0.5% to 1.75%), members can transfer to a debit card within minutes.
For retailers, industrials, and other businesses, customers measure speed in terms of on-time, in-full (OTIF) delivery percentages. Most data is proprietary and internal to the company, so we measure customer perception of delivery speed by the gap between their expectation and satisfaction levels. The smaller the gap, the better the company’s performance level.
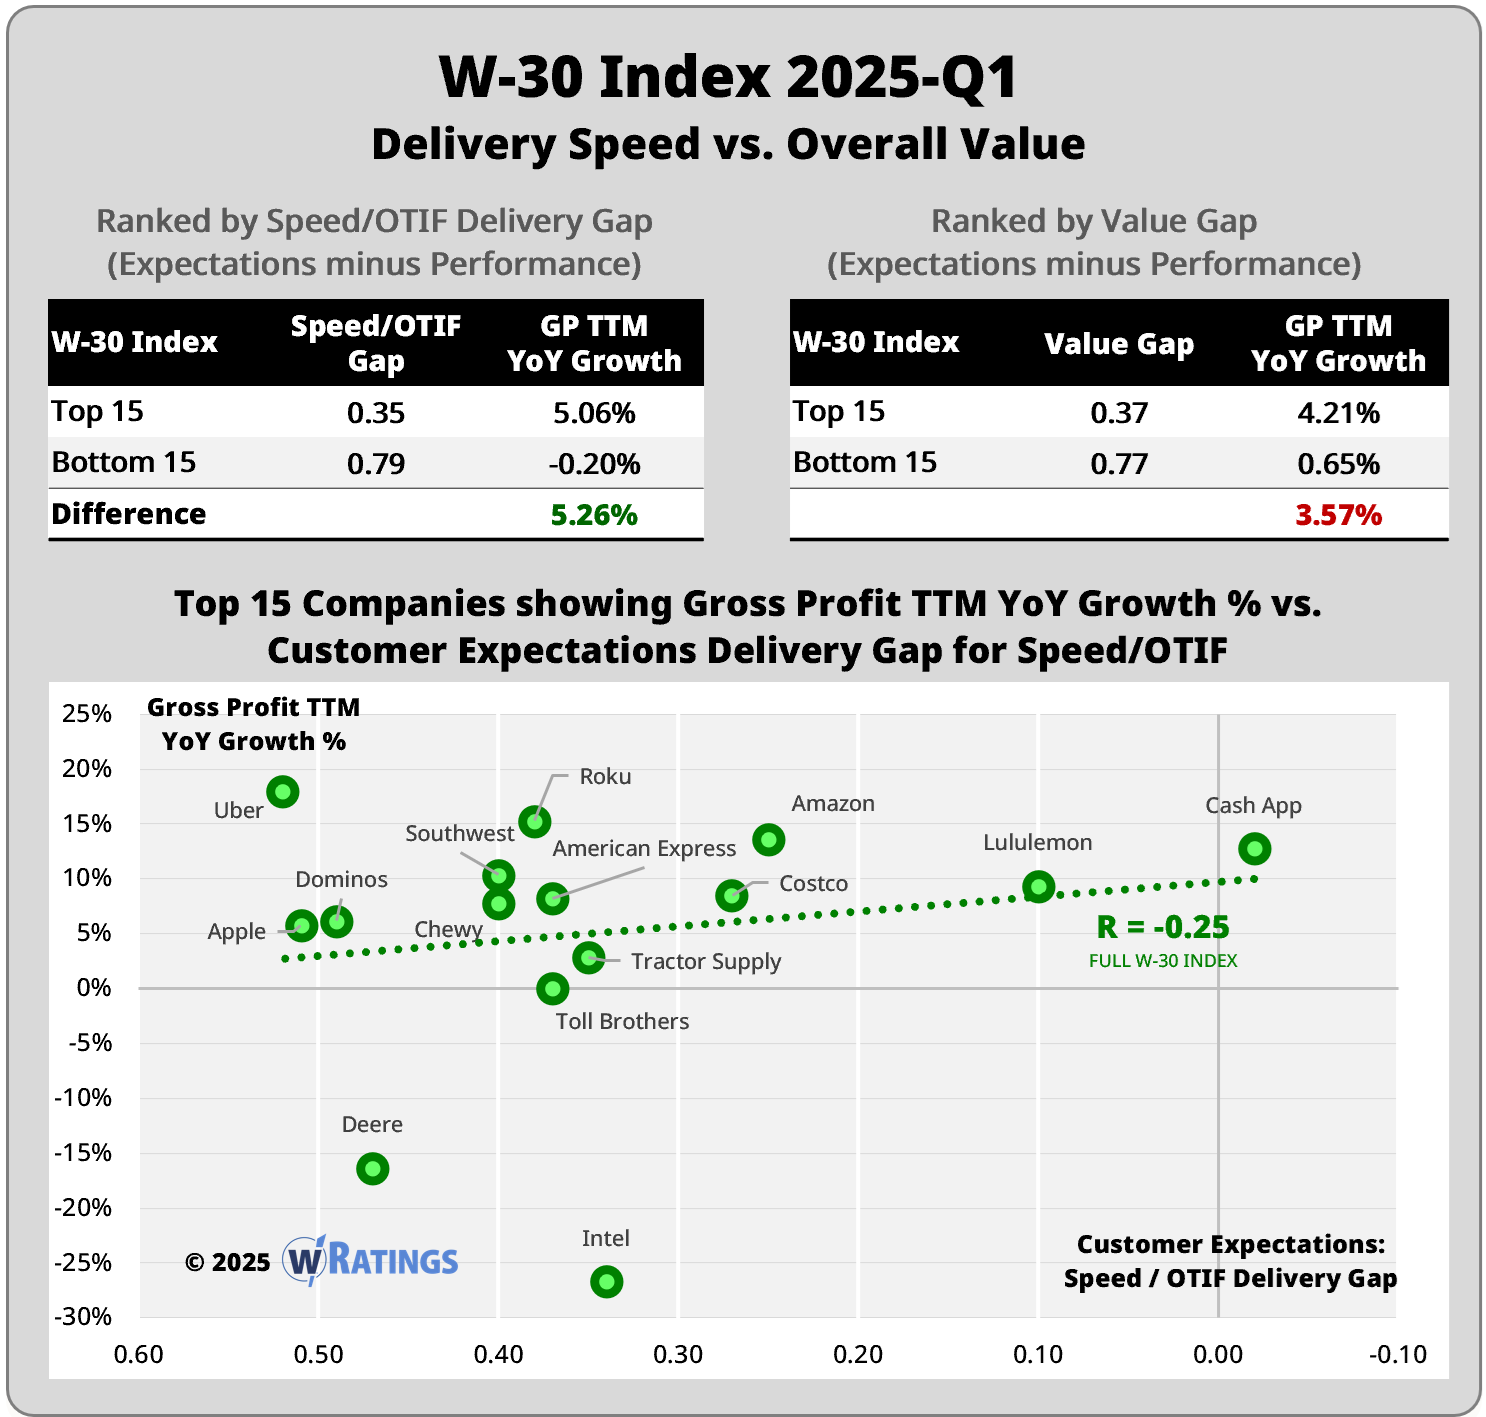
After ranking the W-30 Index by their Speed/OTIF Gap, the top 15 companies outperform the bottom 15 by 5.26% when looking at Gross Profit TTM YoY growth. Ranking the same companies by overall Value Gap (12 functional needs including Speed/OTIF and 5 emotional needs), the top 15 companies still outperform the bottom 15 but only by 3.57%.
When it comes to generating more GP growth, companies that are better at speed/OTIF delivery will have an advantage over others. Two caveats exist though.
In contrast to baseball’s Total DRS impact on % Wins, not much correlation strength exists (r=-0.25) between GP Growth and Speed/OTIF. This makes sense since GP volatility is much higher in business than % Wins in baseball.
The second caveat is much more critical to building a competitive advantage. Based on our customer data collected over the last 25 years, top performing companies select fewer initiatives with greater economic impact. In other words, “less is more.”
The precursor to an economic moat is a customer moat, and speed/OTIF delivery is the key customer attribute contributing to a Time Authenticity moat with customers. Companies best known for this moat are Amazon, Cash App, Chewy, Dominos, and Southwest. They deliver with speed, consistency and transparency in every interaction. Responsiveness to customer inquiries often factors into customer perception.
Superior Speed/OTIF Delivery creates a barrier between your customers and your rivals taking them away.
Let the wRatings platform show you where your customer moats are today or could be built in the future, and how much customers are willing to pay for each moat you build.
If you’d like access to our Moneyball analytics and our benchmarking database, apply to become a wRatings Insider here.