

Contact Us
Contact Us


All trademarks are properties of their respective owners.
The 2025 NBA Playoffs are here. Is your team still playing or already eliminated? Why do some teams seem to be in the playoffs year after year, while others struggle? Whether you are on board with this or not, success comes down to one word: Analytics.
Similar to Bill James’ Sabermetrics in baseball, the statistical analysis happening behind the scenes have become a required part of a successful NBA team, season, and franchise. Today’s analytics goes well beyond simply signing players that are tall with long arms (wingspan) and long fingers (hand size), although your chances of making the NBA double with each inch you grow.
NBA Moneyball has changed the way the game is played. From team construction to analyzing shots at the end of a game, sports analytics have helped Owners/GMs optimize their chance of winning. At the core of all this data-driven decision making is talent identification. And for that, DPM (Daily Plus Minus) is considered the gold standard.
Why DPM? Virtually all other NBA metrics are rear-view mirror and built to answer questions about the past. DPM solely looks forward. The metric blends traditional box-score numbers with play-by-play statistics to separate a player’s actual talent from the random noise found in any single game. DPM combines offensive and defensive ratings into an all-in-one metric to predict each player’s impact on the score for the next game.
At wRatings, our analytics are similar in their patented, forward-looking capabilities, going far beyond traditional “box-score” numbers like NPS® or satisfaction. Our methods identify which customer needs are most contributing to the profitable sales growth of a company. Our “DPM” in the world of sales growth analytics is a Value Gap, which is the difference between what customers expect and how a company performs.
But first, let’s dig into the top performing players in the NBA so far this season, and their impact on the outcome of the 2025 Playoffs.
And now for us stats geeks – just this one paragraph I promise.
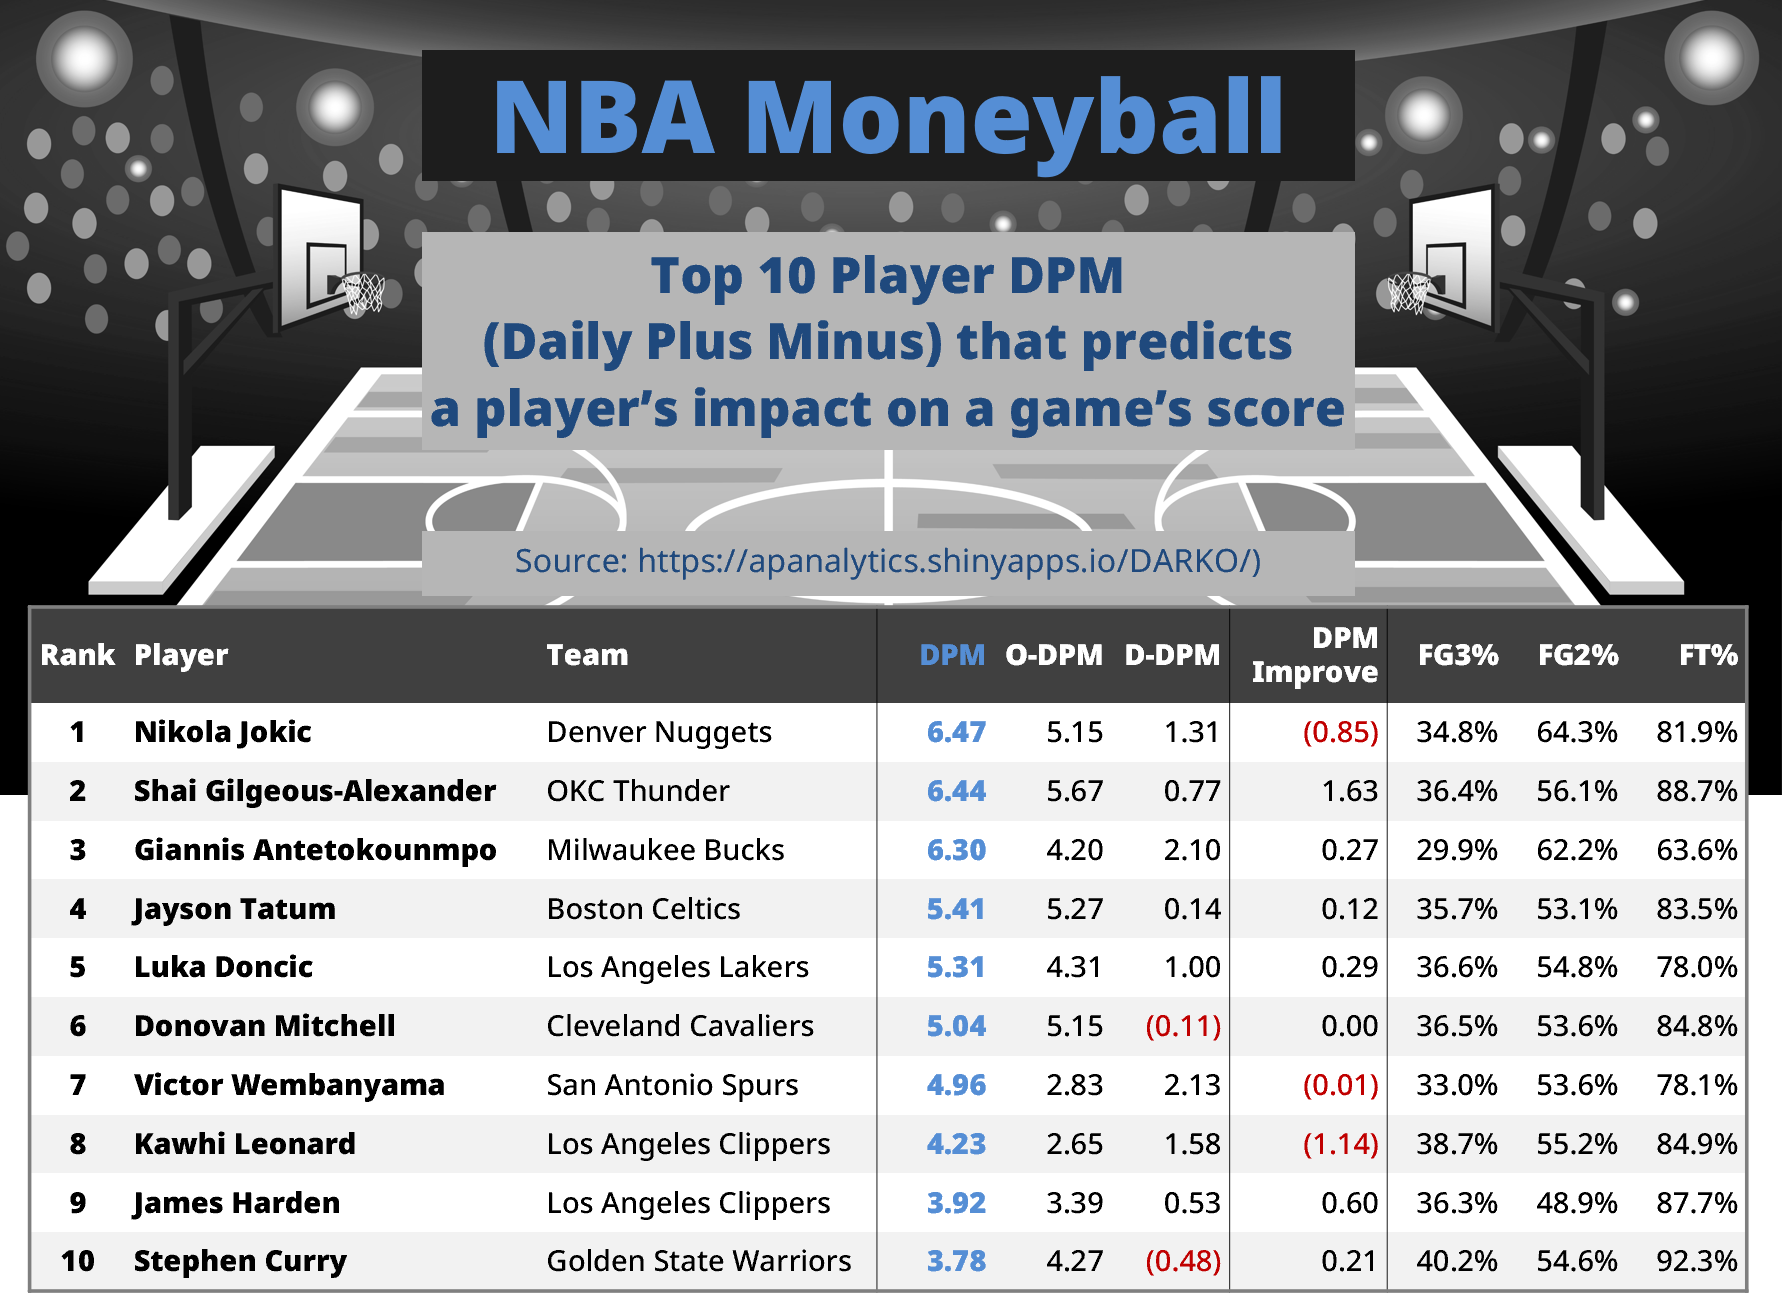
DPM (Daily Plus Minus) is the metric DARKO uses to measure the impact of a player on the score for the next game. The DARKO DPM uses traditional box score data like points, assists, turnovers, steals, and blocks as input. The final DPM then blends the traditional box score data with on-off data, which is the difference in team performance when a player is ON the court versus OFF the court. O-DPM is a player’s impact on the team offensive performance, whereas D-DPM is impact on the team defensive performance. Positive values mean the player improves the team performance (e.g. +2.1 means the team is 2.1 points better with him on the floor).
Back to how DPM is use by NBA executives.
Looking at the current DPM (4/27/2025), Nikola Jokic is the most impactful NBA player at 6.47. Steph Curry is #10 at 3.78. What hurts Steph is his defense, where the team is -0.48 points when he’s on the court. The only playoff team with 2 players in the top ten is the Los Angeles Clippers, with Kawhi Leonard and James Harden. Could this favor them to win this year’s championship? Quite possibly.
But we should also look at a player’s performance trend, measured by DPM Improvement. Only Nikola and Kawhi are trending down, indicating both are declining in their ability to impact the score of a game. Although updated daily, this season over season stat provides an unbiased look at whether a player’s performance is on the rise or not. Although Nikola is the best player right now, he is also falling over time.
The similarities between DARKO and wRatings metrics are quite remarkable:
Using customer interviews from our quarterly panels, we measure how well today’s top companies are meeting their expectations. Value Gaps are an all-in-one metric that measures the difference between what customers expect and how well a company performs. The measurements come from a set of functional and emotional needs that are proven to be predictive of a company’s revenue growth.
Customers rate their importance and satisfaction levels on core functional areas such as quality, speed, availability, and pricing. They also provide intensity ratings on emotional levels such as trust, connection, and creativity. Similar to DPM’s scores on a player’s offense and defense, we blend our scores on satisfaction (functional) and emotion gaps to arrive at an overall customer Value Gap.
To profitably grow revenues, companies must focus on closing their customer value gaps. Because customer expectations can and do change regardless of a company’s performance, value gaps are dynamic over time and amongst key rivals. On many occasions, customer expectations can be shaped by companies from other industries (e.g. Amazon with on-time delivery).
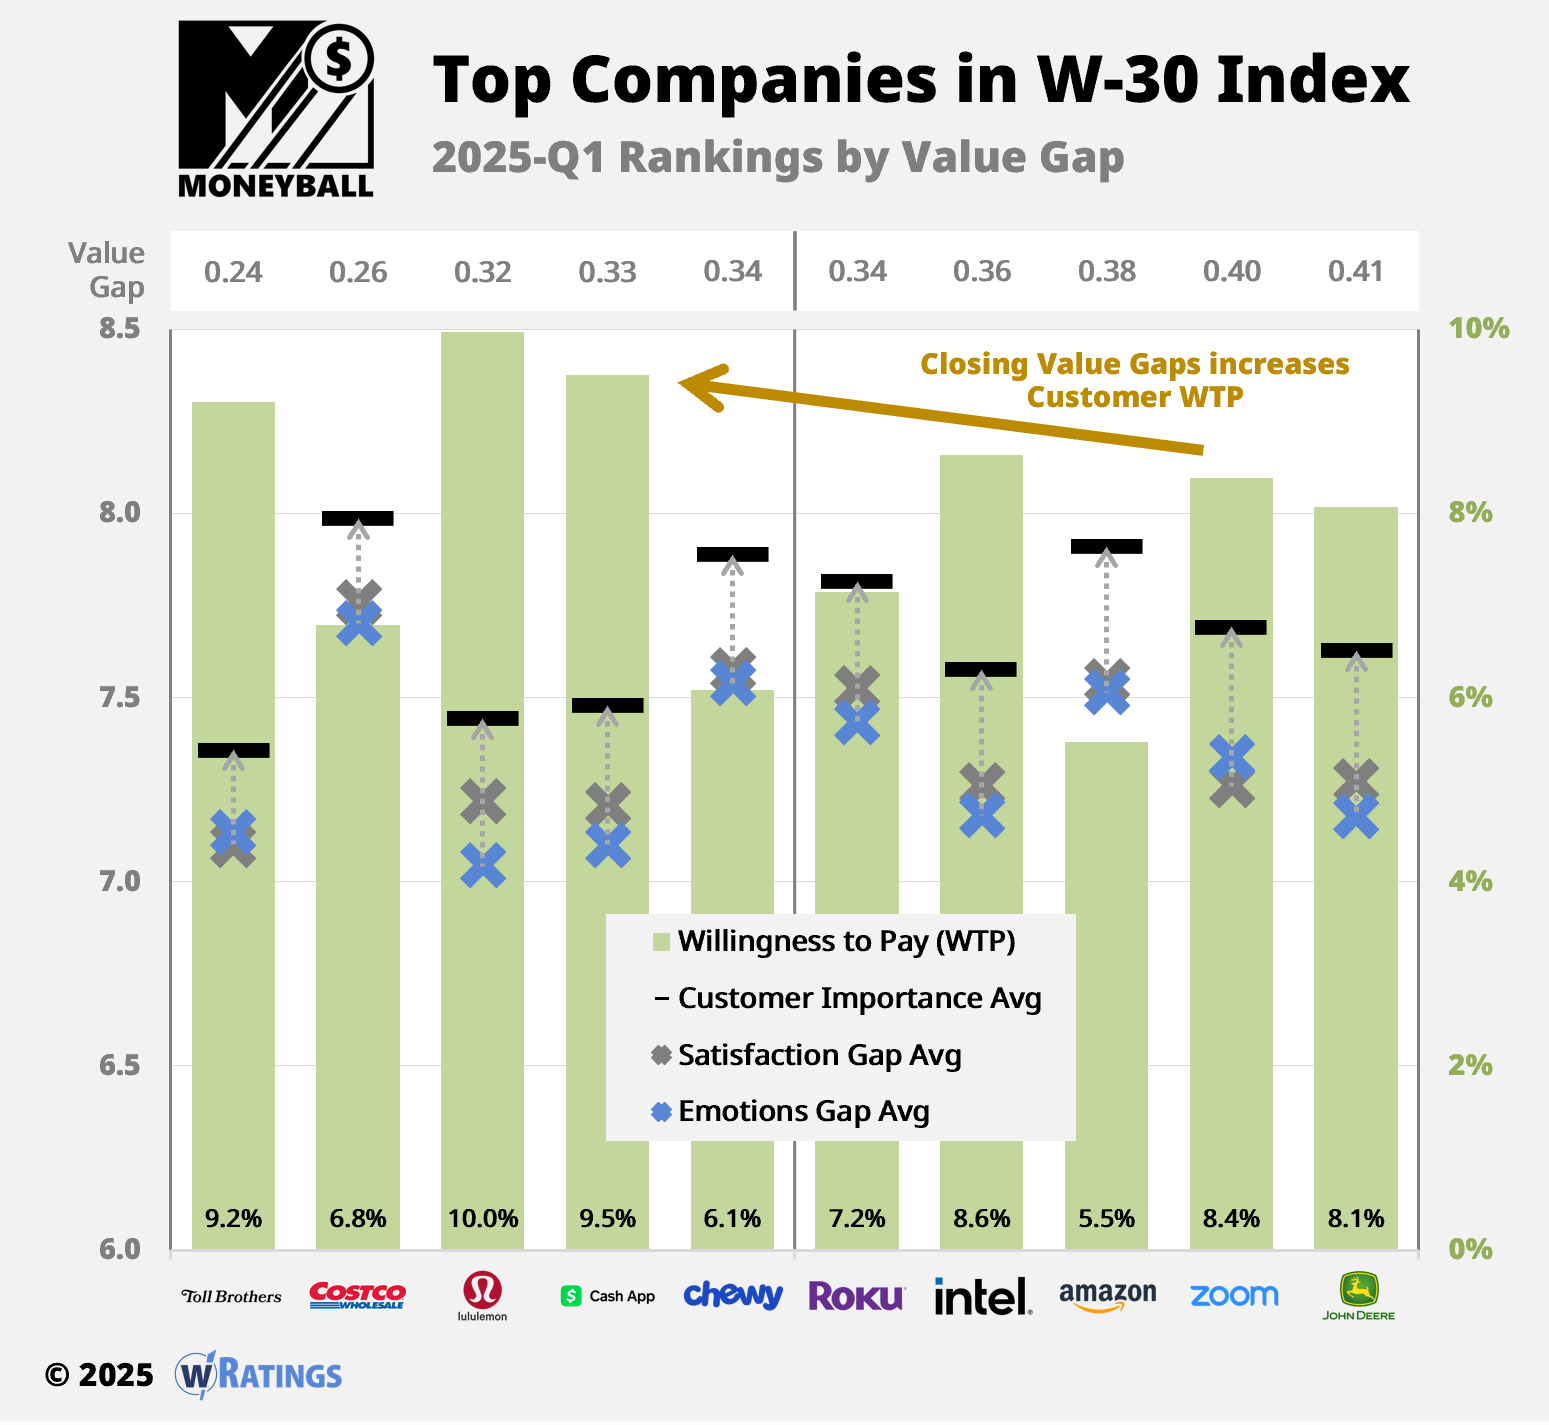
The chart shows the top 10 best performing companies from our W-30 Index, which are selected from our larger coverage of many S&P 500 companies. Nikola and Steph are ranked #1 and #10 in DPM; Toll Brothers and John Deere are also ranked #1 and #10. And comparably, the scores inside of the ranks are also quite different.
Toll Brothers does an outstanding job at setting customer expectations properly, with an average importance level of 7.36. Deere’s expectations are more than a quarter point higher at 7.63, making it a higher ask to meet. Being a premium house builder, Toll Brothers excels at delivering a strong, customer emotional experience (blue X in chart) that even exceeds their satisfaction levels. Customers of Deere, even though the company is historically a well-respected brand, are not feeling a strong emotional bond with the company currently.
As a company closes its value gap, customer willingness to pay (WTP) increases ~70% of the time based on Bayesian calculations. To win more business and grow revenues, companies must find ways to better meet customer expectations. Our analytics show companies precisely where to focus efforts while reducing costs by eliminating wasted efforts.